Nasdaq-100 Rebalance Non-Predictive Strategy
A report on post-announcement addition-long and deletion-long rules, train/test timing surfaces, and hedge considerations.
Timing parameters were optimized on 2018–2023 data and then frozen for the 2024–2026 holdout period.
Executive Summary
The most profitable non-predictive strategy combines deletion-long and addition-long, creating a 49% CAGR (compound annual growth rate), compared with roughly 29% a year for a passive Nasdaq-100 buy-and-hold strategy over the same historical period.
We downloaded price data going back to 2018 and split it at 2024. The trade timings are tunable parameters and are optimized on the earlier 2018-2023 training set. After training is finished, we freeze the timings parameter and run the trading strategy on the later 2024-2026 period, hence calculating the CAGR. We isolated data from later periods from the training procedure to probe the generalizability of the strategy.
To check that the headline number is stable and not driven by a single lucky event, we ran leave-one-event testing: we re-measure the 2024-2026 test CAGR many times, each time dropping one event from the period, and take the standard deviation across those runs. That standard deviation was about 9 percent, and the worst leave-one-event test case yields a CAGR of 27%, suggesting robustness against sporadic events.
Hence, we believe this strategy significantly outperforms baseline buy-and-hold strategy on NASDAQ-100 index.
1. Main Conclusions
The highest-return non-predictive strategy is like this. For each Nasdaq announcement of Nasdaq-100 membership change, do the following:
A "trading session" refers to one day that the stock market is open. A "rebalance group" refers to the set of stocks that Nasdaq announces as joining or leaving the index on the same change, so their trade windows line up and share one pool of capital. In the worked timeline below, trades are modeled at the market close on the selected offset session.
The strategy is executed only after Nasdaq has officially announced an index change. It does not attempt to predict future additions or deletions before the announcement. The tested implementation is:
- Wait for the official Nasdaq-100 change announcement.
- Exclude non-primary cases such as mergers, spin-offs, scandal-screen failures, and rows with missing trade dates or symbols.
- For deletion events, buy the removed ticker 10 trading sessions after announcement and sell 12 trading sessions after the effective date.
- For addition events, buy the added ticker 6 trading sessions after announcement and sell 16 trading sessions after the effective date.
- Use one shared portfolio account. Within a rebalance group, split that event allocation equally across all eligible tickers.
- When addition and deletion event windows overlap, reserve/split capital across the known open event groups. The aggressive version may use overlap margin up to 2.0x gross exposure.
- Reinvest realized gains and idle cash; idle cash earns the 3% annualized cash-rate assumption.
A worked example of a single rebalance — on the same announcement, AppLovin (APP) joins the Nasdaq-100 and Dollar Tree (DLTR) leaves it. Each ticker keeps its own color below across both its buy and its sell; the announcement and effective dates are shown low-key, since the strategy only reacts to them. No trade is placed on the announcement day itself.
2. CAGR Heatmaps
The train and holdout timing surfaces show how the selected trading-session offsets behaved across nearby parameter choices.
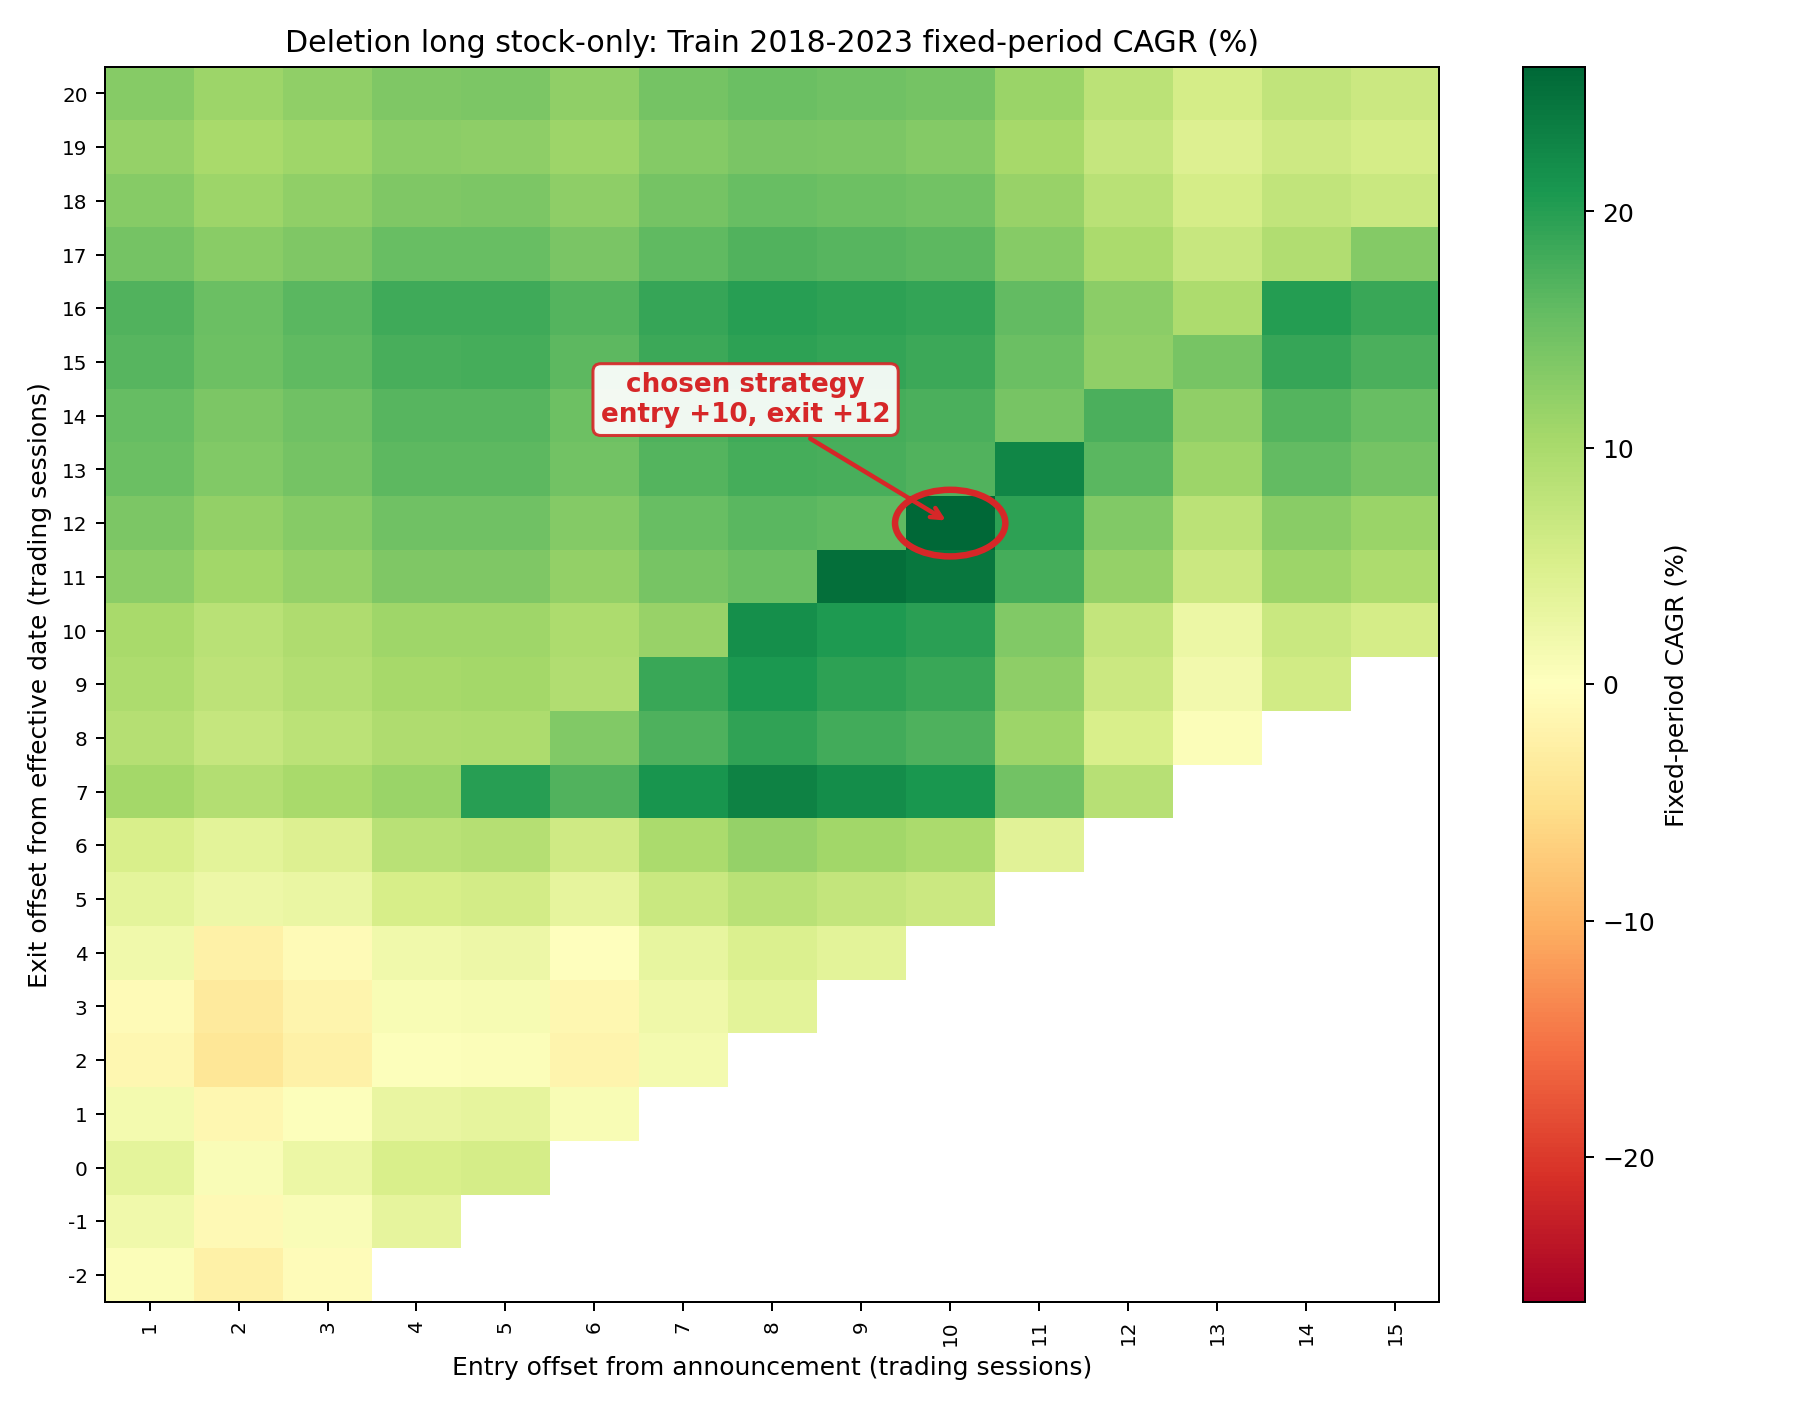
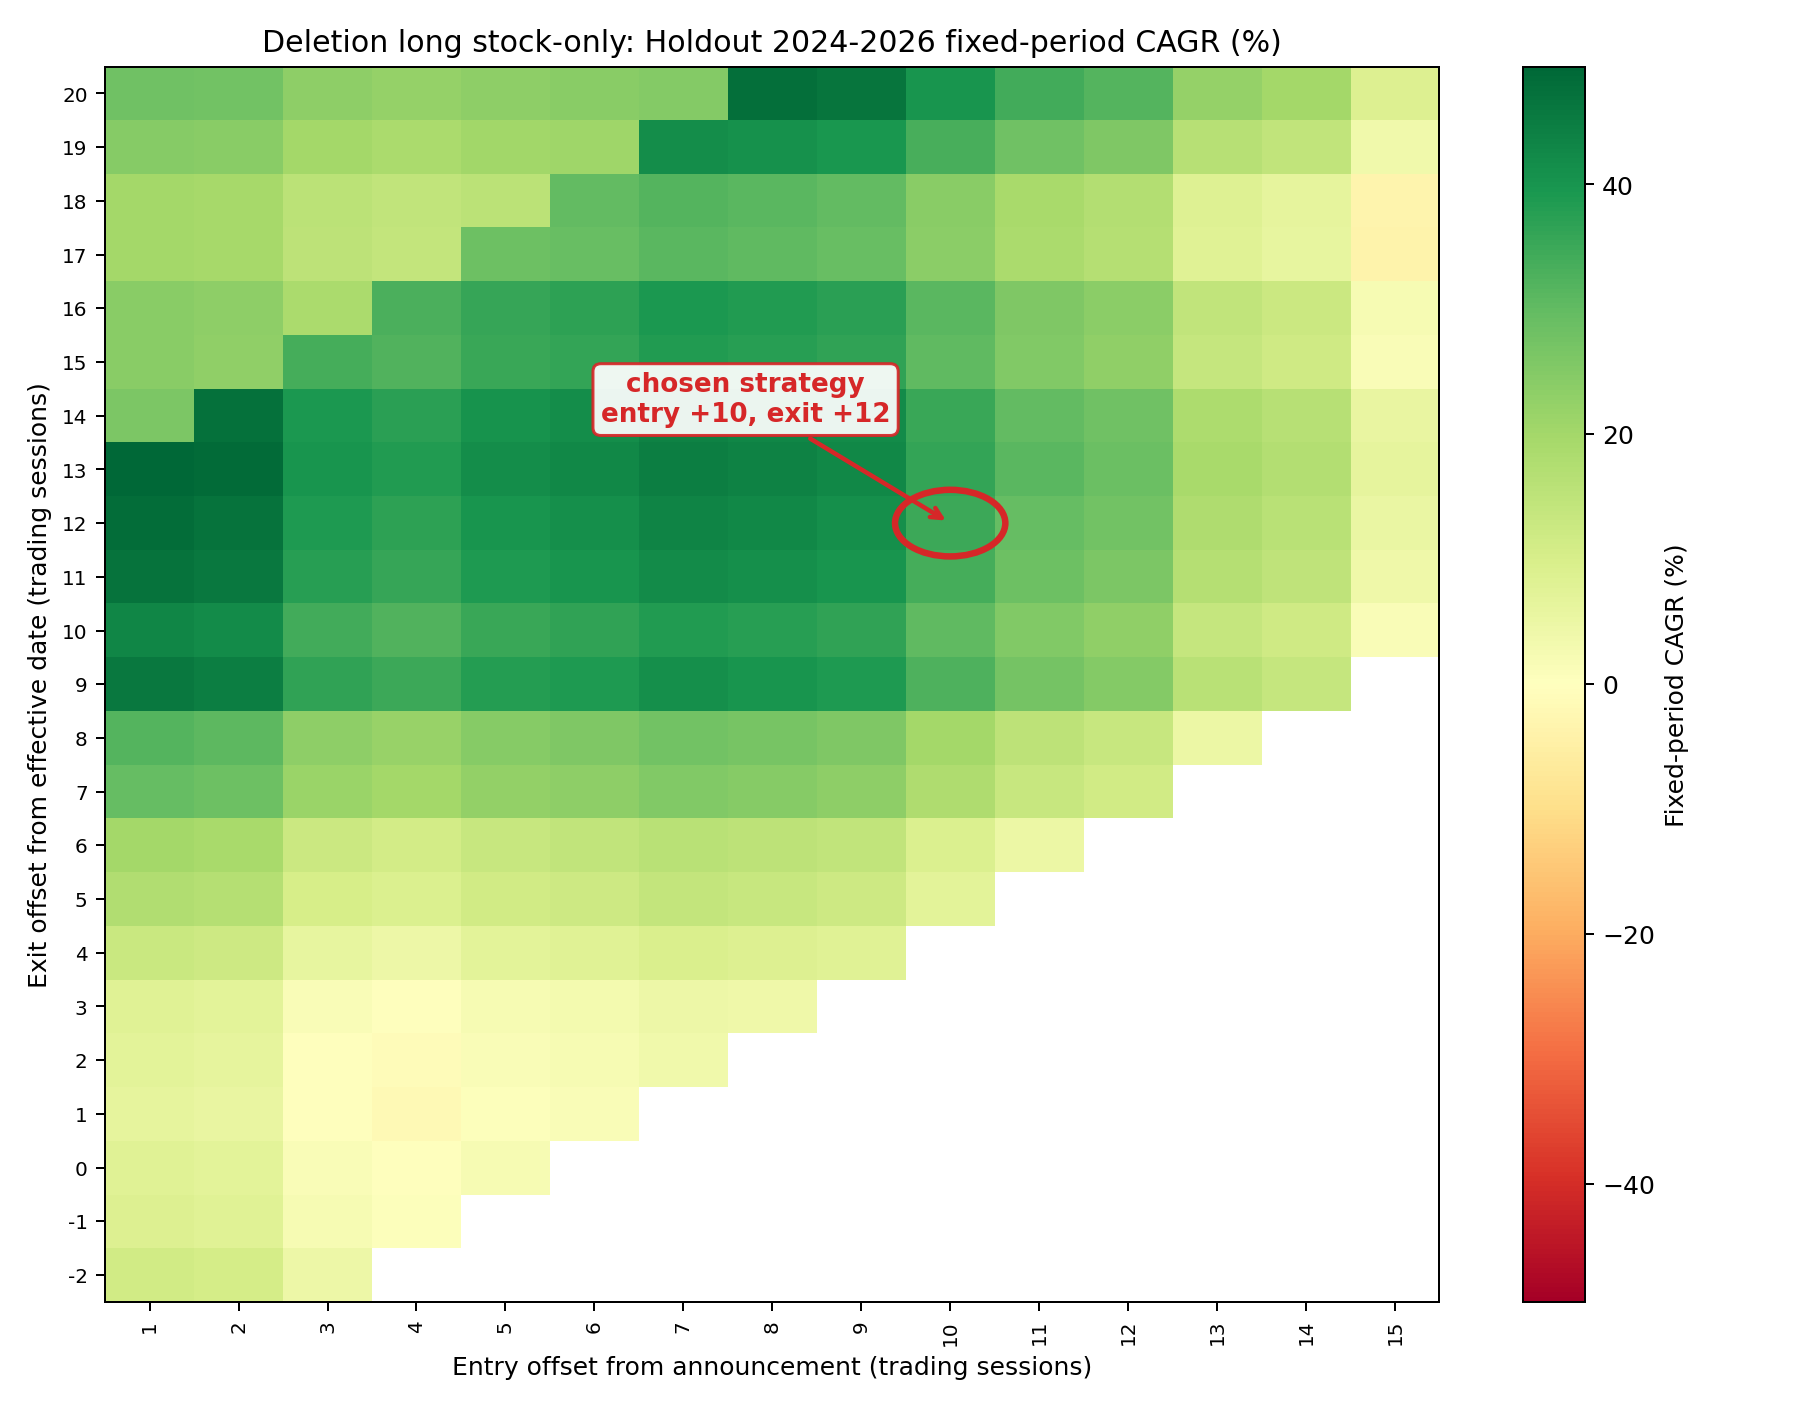
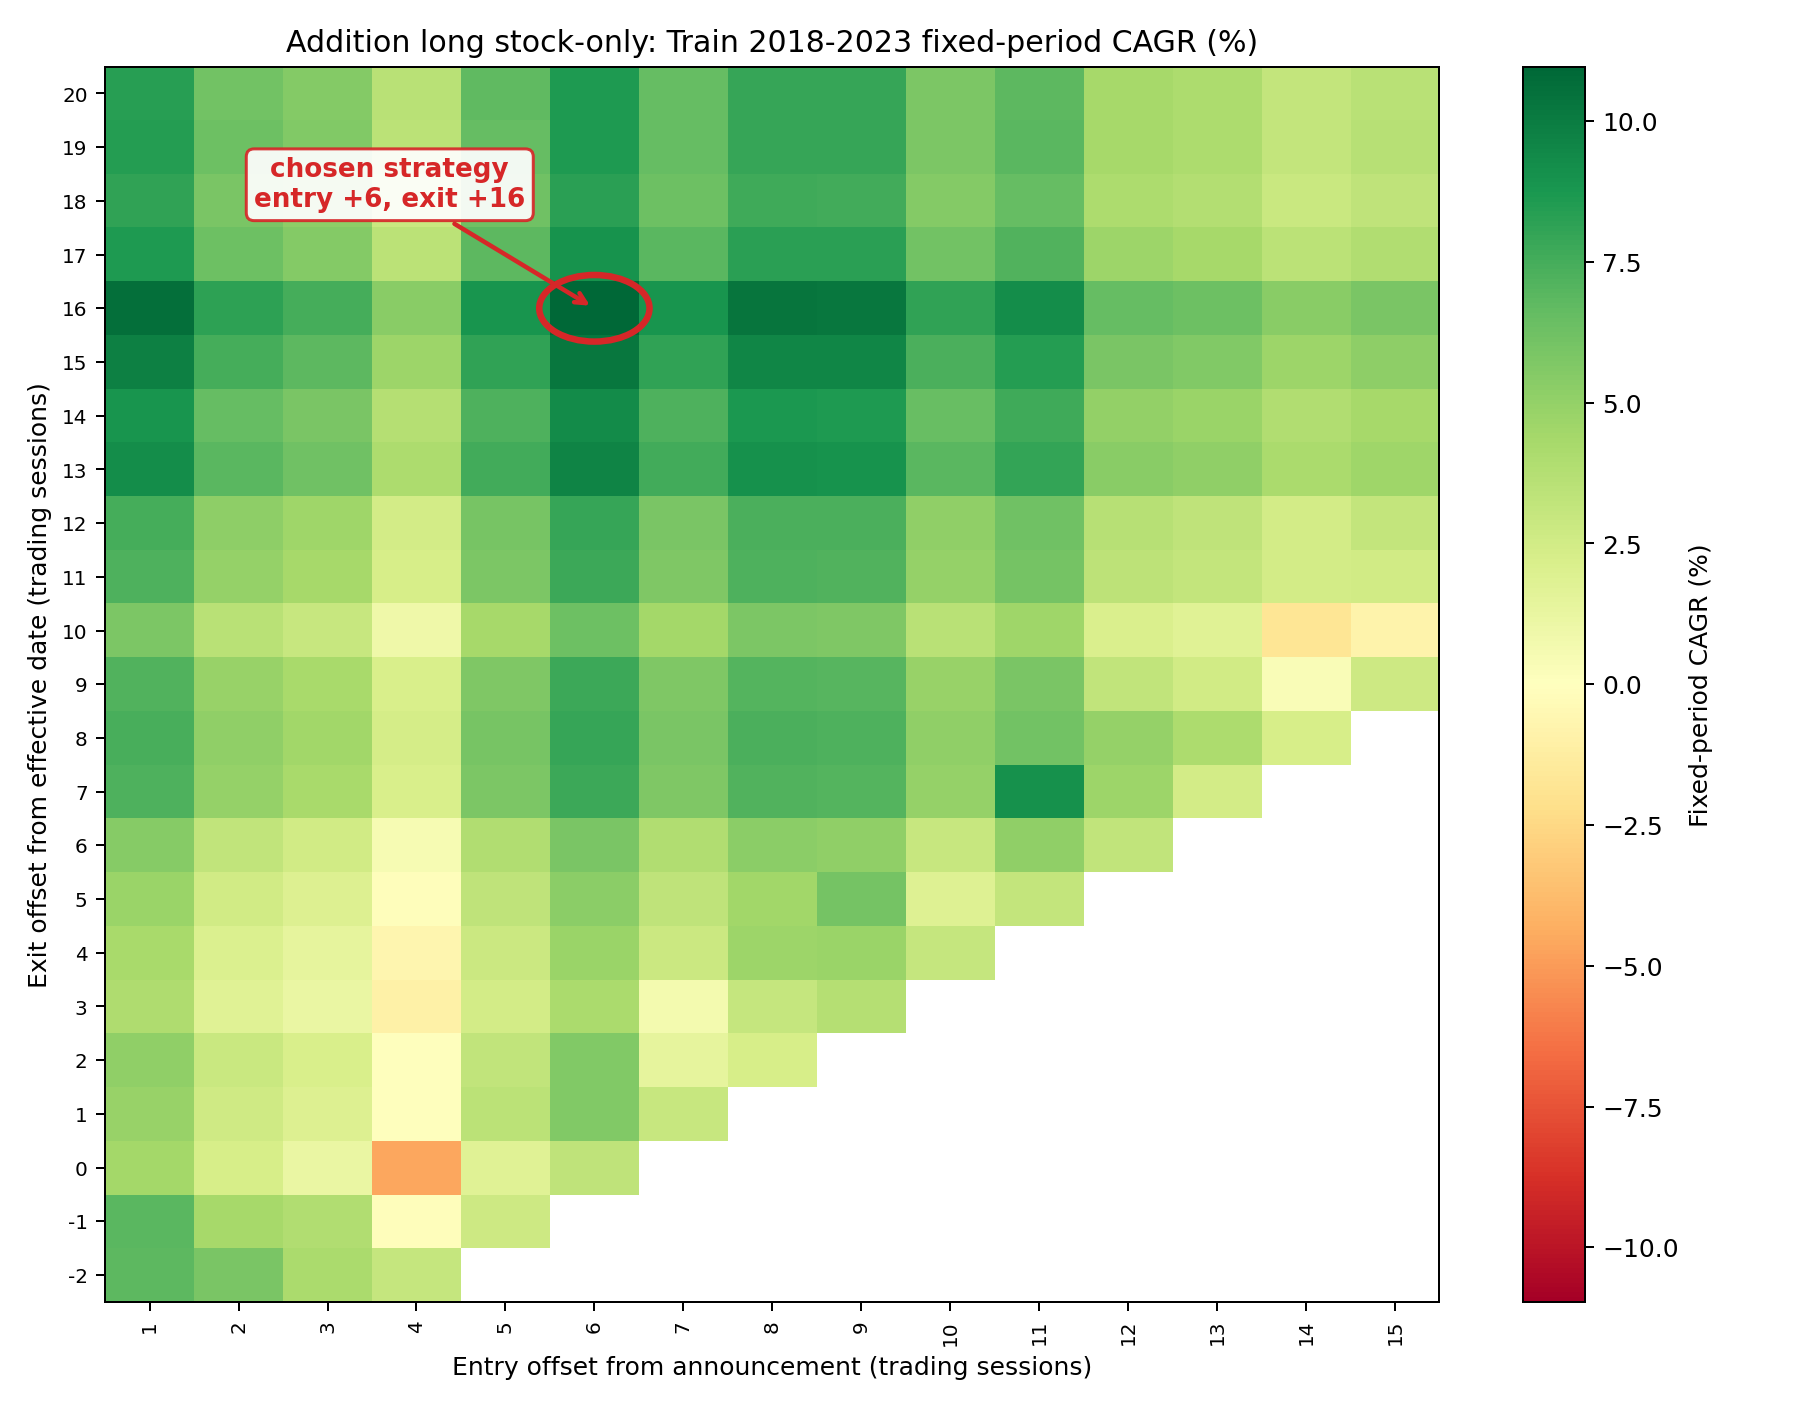
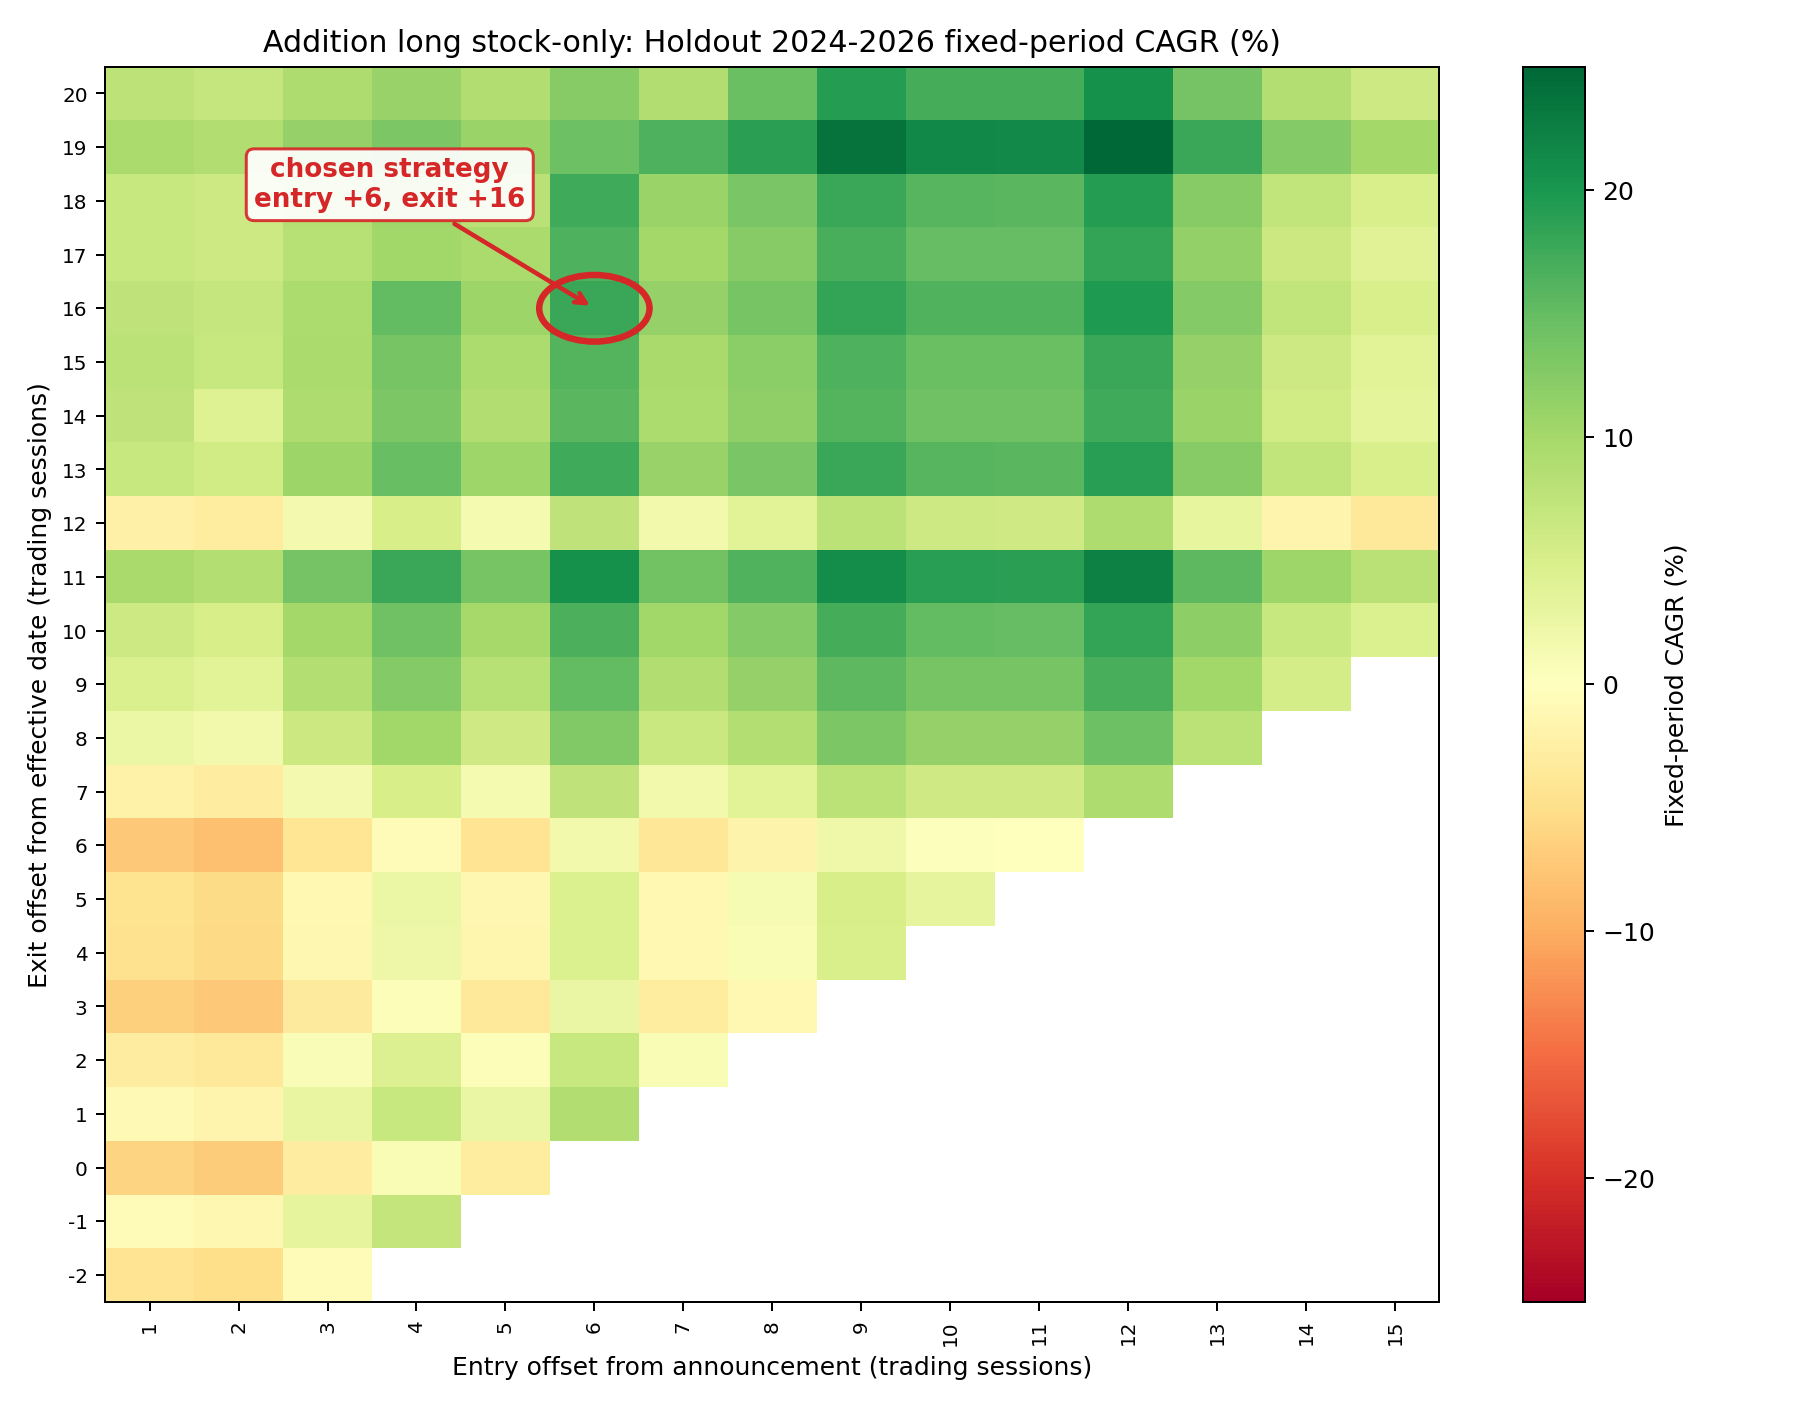
The triangular green region may be a sign that one or a few tickers drive a significant share of the strategy's return. But those returns occurred at different times relative to the announcement and effective dates. This is an inspiration for us: to capture the biggest return, we might want to dynamically allocate a different long/short timing offset for each ticker rather than applying one fixed offset across them all.
Discussions
About whether to short QQQ to hedge
The headline strategy holds the stock outright (long only). A natural question is whether to also short QQQ against each position to hedge out broad Nasdaq-100 moves, so the return reflects the deletion/addition effect itself rather than wherever the whole market happened to drift during the holding window.
The ticker-vs-QQQ correlation is a good justification either way. When a name is tightly tied to QQQ (high beta and high R²), a QQQ short cancels most of that shared market movement and leaves a cleaner, lower-variance bet on the event itself — the hedge earns its keep. When a name is only loosely tied to QQQ (low R²), a QQQ short removes little of the position's variance while still costing borrow and adding a second source of profit and loss, so hedging tends to hurt more than it helps. The diagnostics below measure exactly that tie-strength before each announcement.
These diagnostics estimate ticker-vs-QQQ beta and R² before announcement. They are context only and are not used as a trading signal or parameter selector.
Hourly window: A-60 to A-30 trading sessions using the shared data/hourly/ bars (including any rebalance-correlation backfill merged there). Daily window: A-100 to A-30 trading sessions using the expanded 2018-2026 daily-compatible files. Returns are aligned by timestamp for hourly and by session close for daily.